Transparent Formula
Every output can be reproduced with a normal calculator; there is no hidden score or invented AI prediction.
Reviewed by Thumbnail Studioo · Updated 20 August 2026
Calculate My Thumbnail CTRFree calculator
Use the impressions and views from YouTube Studio’s Reach tab. This estimates packaging performance; it does not predict what a new thumbnail will achieve.
5.00%
Views from impressions ÷ registered impressions × 100
Views at target
600
Potential difference
+100
AI thumbnail generator
Describe the thumbnail you want and generate it directly on this page.
Your thumbnail will appear here
Write a description and choose a style to get started.
Benefits
Every output can be reproduced with a normal calculator; there is no hidden score or invented AI prediction.
See the view difference at the same impression count, making a percentage change easier to understand.
The page explains why traffic source, reach, and audience maturity change how CTR should be interpreted.
Move from arithmetic to visual preview and then to YouTube’s real concurrent experiment.
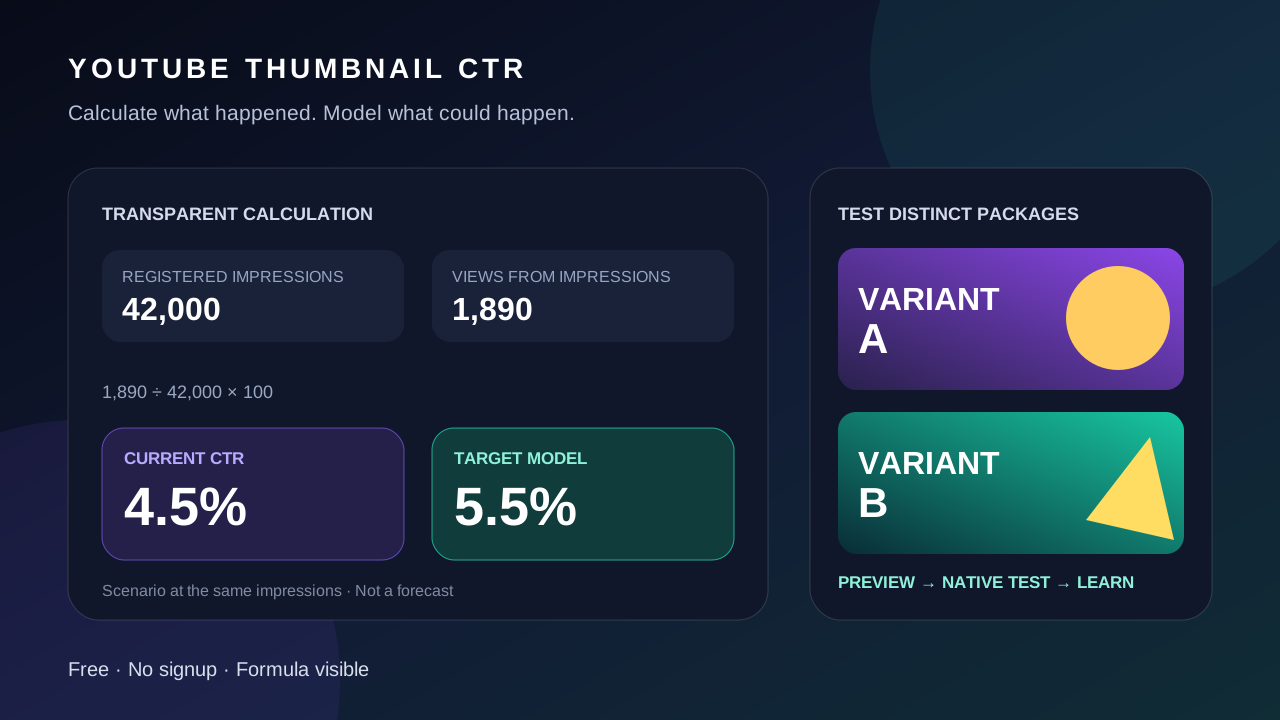
If a video records 42,000 registered impressions and 1,890 views from those impressions, its calculated CTR is 4.5%: 1,890 ÷ 42,000 × 100. At the same 42,000 impressions, a hypothetical 5.5% target equals 2,310 views from impressions, a difference of 420. That difference is a scenario, not a forecast, because changing the package can also change who receives the impression and how viewers respond.
YouTube explains that CTR varies by audience, content, and traffic surface, and it may fall as a video reaches beyond its core viewers. Diagnose the package with context instead of optimizing one number in isolation.
| Signal | What It Can Tell You | What to Check Next |
|---|---|---|
| CTR rises, impressions stable | The new package may be more relevant to a similar audience | Watch time, retention, and test duration |
| CTR falls, impressions rise | The video may be reaching a broader audience | Total views and traffic-source mix |
| CTR rises, retention falls | The package may attract clicks that the video does not satisfy | Opening promise and thumbnail accuracy |
| Search CTR differs from Home | Viewer intent and placement are different | Compare traffic sources separately |
| Small gap between variants | The evidence may be inconclusive | Collect more data and avoid declaring a winner early |
How It Works
Copy registered impressions and views from impressions for the same video and date range.
The calculator divides views from impressions by registered impressions and multiplies by 100.
Use the video’s own history, traffic-source mix, and comparable uploads, not a universal benchmark, to choose a target.
Create materially different variants and use YouTube’s native title-and-thumbnail test, which selects winners by watch time.
Examples


Who It's For
Creators reviewing the Reach tab
Channel managers reporting packaging performance
Agencies modelling a target without inventing guaranteed views
Teams deciding whether a thumbnail test is worth running
Try These
“Compare 42,000 registered impressions and 1,890 views from impressions, then model a 5.5% target”
“Calculate the difference between the current thumbnail at 3.8% and a target of 4.5% without changing impressions”
“Use the result to plan two genuinely different title-and-thumbnail packages for a native YouTube test”
YouTube Studio reports CTR, but creators often need to model the practical difference between two rates or explain performance to a client. The useful question is not “is 5% good?” in isolation. It is how the same video changes over time, by traffic source, audience reach, and title-thumbnail package.
The calculator uses the visible formula: views from impressions divided by registered impressions, multiplied by 100. It also models the view difference at a user-chosen target while holding impressions constant. Read the result alongside YouTube's impressions guidance, compare visual variants in the thumbnail tester, and use YouTube Studio's native test before declaring a winner.
Best Practices
Compare the same video over consistent time ranges and note traffic-source changes.
Use views from impressions, not all views, so the numerator and denominator refer to the same registered surfaces.
Test meaningfully different concepts rather than tiny color changes.
Judge retention and watch time alongside CTR so the thumbnail promise matches the video.
Let a test collect enough impressions before treating a small difference as meaningful.
Common Mistakes
Dividing all video views by registered impressions.
Treating 2–10% as a target every channel must hit.
Assuming a higher CTR always means more total views.
Changing the title, thumbnail, and audience strategy simultaneously.
Calling a projected view difference a forecast or guarantee.
Preview materially different variants, then run the strongest options through YouTube Studio’s native experiment.
Calculate My Thumbnail CTRFree 3-day trial • Cancel anytime
FAQ
Views from registered impressions divided by registered impressions, multiplied by 100. Use the matching metrics from YouTube Studio’s Reach tab.
YouTube says half of channels and videos fall between 2% and 10%, but traffic source, audience size, video age, and reach all affect the number. Compare your own videos over time instead of treating that descriptive range as a universal target.
As YouTube shows a video to a broader audience, more impressions can produce more total views even if a smaller percentage clicks. Reach and CTR should be interpreted together.
No. It calculates observed performance and models a hypothetical target at the same impression count. Only real audience exposure can measure a new package.
YouTube’s native test evaluates the title-and-thumbnail combination using watch time share, because a good package should attract the right viewers rather than clicks alone.